It has been almost 6 years since our first comparison of mobile phones, many things have changed in that time, so today we are publishing our second edition of our comparison – Mobile Phones Comparison 2018.
Competitors
All competitors were changed due to big time interval between two comparisons: all previous contestants were replaced by newer models or go extinct. Also the quantity of competitors have raised from 40 to 190.
The current set of competitors include mobilу phones from 21 phone manufacturers: Samsung, Motorola, Xiaomi, Asus, LG, Honor, Meizu, ZTE, HTC, Sony, Huawei, Apple, Nokia, Lenovo, OnePlus, Google, Microsoft, Alcatel, BlackBerry, HP, Jolla.
In terms of operating systems there are 172 smartphones on Android, 6 on iOS, 7 on Windows, 2 on Tizen and 1 from BlackBerry OS, Sailfish and Ubuntu Touch.
From Android and iOS phones we had tested only mobile phones that became available during last year. Considering other OSes we had tested some most recent devices, because no new devices were produced during last years.
Methodics
Methodics of comparison have changed too. Previously presented criteria were updated to better represent current state of things. New criteria – Availability and Acceptance were added.
Due to this changes current set of criteria is: Availability, Hardware, Software, Store and Acceptance.
Smartphones results in each category: availability, hardware, software, store and acceptance are calculated as average of all parameters in the category multiplied by data completeness coefficient. Final result is calculated as average of categories results, taken with the coefficients corresponding importance of this category. Category cofficients are: availability, hardware, acceptance – 0.2, store – 0.1, software – 0.3.
Availability is calculated based on mobile phones prices in stores around the world as well as on their presence in them.
Hardware metric is calculated based on such parameters as size, weight and durability of phones, also on their screen, battery, camera, CPU, memory, networks, sensors specifications.
Software metric is based on functions, available in operation systems they are running.
Store metric is calculated on metrics of application store, available on operation system.
Acceptance metric is based on results of experts and users reviews, as well as on sales volume.
Results
Our top-3 phones are:
- Samsung Galaxy Note8 with 64 GB of storage
- Samsung Galaxy S9+ with 64 GB of storage
- Lg V30+
The best Apple phone is iPhone 8 Plus with 64 GB of storage.
The best Windows phone is Microsoft Lumia 950 XL.
Results table for all smartphones which were compared is given below. Interactive version of results is available at our Testdrive website section. In interactive version you can sort results by all columns, as well as search by phone or operating systems names.
Phone names are consisting of manufacturer name then model name. In case of existing models with different RAM and storage options they are given after the name.
Apple phones showed not so good results as 6 years ago. This is because of two reasons. First reason is that in terms of software Android became on par with iOS. Second reason is that Apple hardware is not improving as fast as in phones from Android manufacturers. Although Apple results are lower than top Android smartphones it does not mean that they are so bad. Apple is the only manufacturer of iOS devices, so they can adjust their OS to run smoothly even on that hardware.
Samsung Galaxy Note9 has low results due to not being available, which reduces amount of available information needed to compare phone.
Analysis
There were a lot of changes both in contestants and methodics, but Samsung phones are still the best available option. Last time we had not included Galaxy Note series in medal standings due to their big size compared to other phones. Nowadays normal phones are almost the same size as them, so we decided not to exclude them this time.
Let’s take a look at results of phone manufacturers.
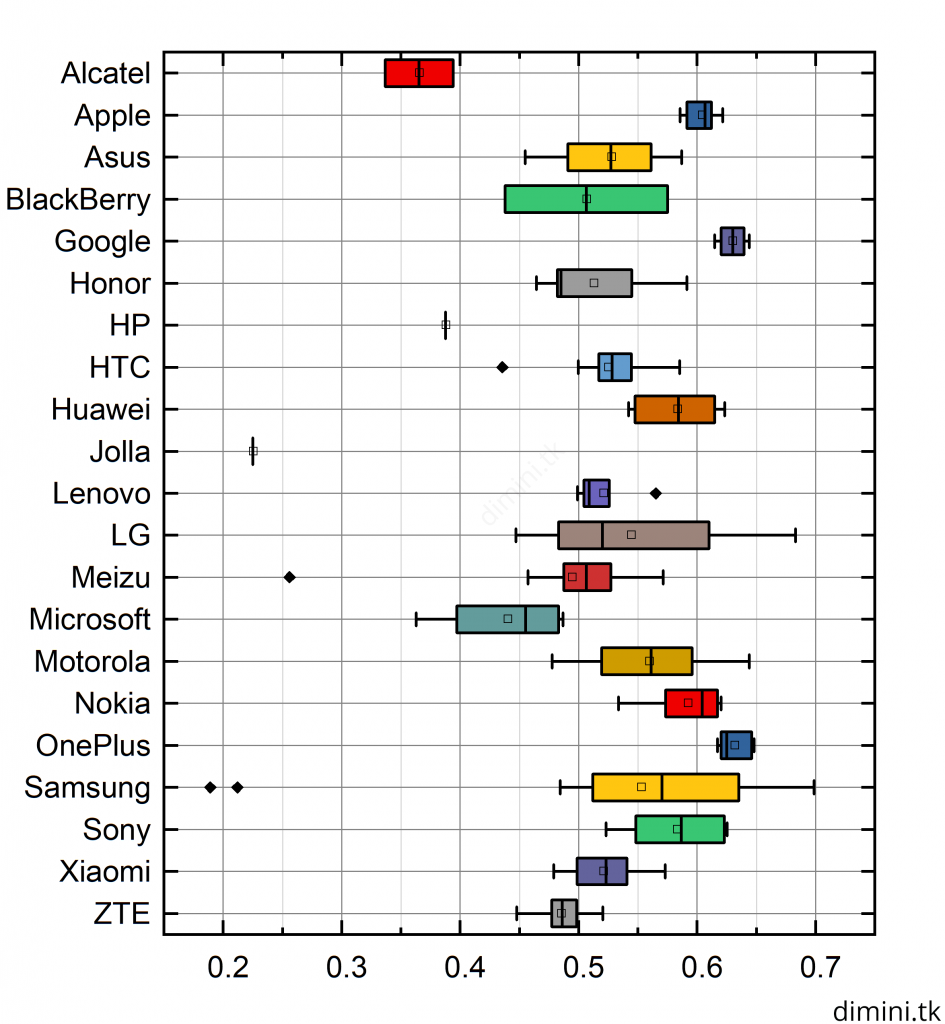
Box chart of phone manufacturers results is given below. Boxes edges correspond to lower (25%) and upper (75%) quartiles of phone manufacturer results. Whiskers correspond to range within 1.5 IQR(interquartile range). Lines inside boxes correspond to median value. Empty squares inside boxes correspond to mean value. Black squares correspond to outliers.
Alcatel and HP have low results because we have only tested several Windows Phones from this manufacturers.
Microsoft is also low, because as well as other Windows Phone manufacturers they are not making new phones, so they only have obsolete phones in comparison.
Conclusion
We hope that our mobile phone comparison will be useful for all of you, however final decision is up to you, because only you can estimate what parameters are more important for you. Also you are the only one who can take into consideration your previous phone models, which is important due to user experience and owned applications list on different platforms.


